


These 75 housing markets hit a critical threshold in favor of homebuyers

Want more housing market stories from Lance Lambert’s ResiClub in your inbox? Subscribe to the ResiClub newsletter.
During the Pandemic Housing Boom, from summer 2020 to spring 2022, the number of active homes for sale in most housing markets plummeted as homebuyer demand quickly absorbed almost everything that came up for sale and sellers had ultimate power. Fast-forward to the current housing market, and the places where active inventory has rebounded to 2019 levels (due to strained affordability suppressing buyer demand) are now the very places where homebuyers have gained the most power.
At the end of June 2025, national active housing inventory for sale was still -11% below June 2019 levels. However, more and more regional markets are surpassing that threshold.
This list is growing:
- January 2025: 41 of the 200 largest metro area housing markets were back above pre-pandemic 2019 inventory levels.
- February 2025: 44 of the 200 largest metro area housing markets were back above pre-pandemic 2019 inventory levels.
- March 2025: 58 of the 200 largest metro area housing markets were back above pre-pandemic 2019 inventory levels.
- April 2025: 69 of the 200 largest metro area housing markets were back above pre-pandemic 2019 inventory levels.
- May 2025: 75 of these 200 major markets were back above pre-pandemic 2019 inventory levels.
Now, at the latest reading for the end of June 2025, 78 of the 200 markets are above pre-pandemic 2019 inventory levels and ResiClub expects that count will continue to rise this year.
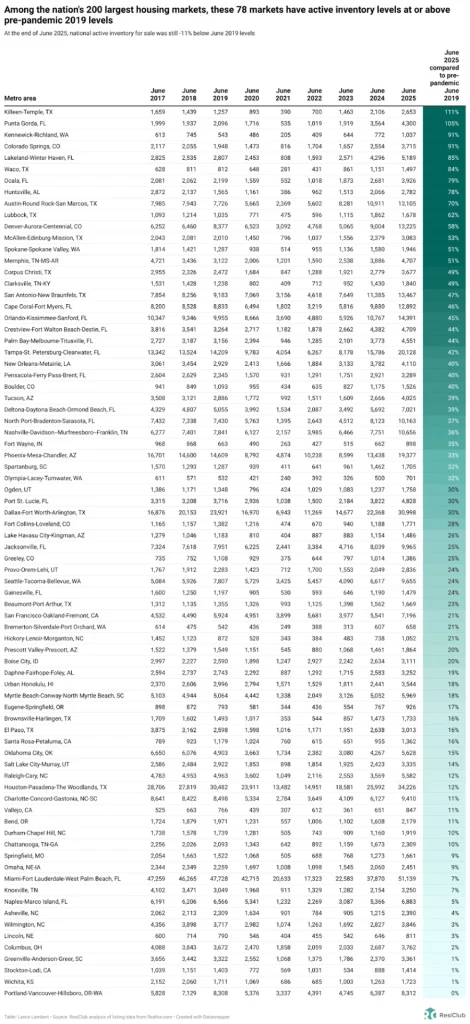
This next table helps you see what the inventory picture in these same 78 markets looks like now and what it looked like last year.
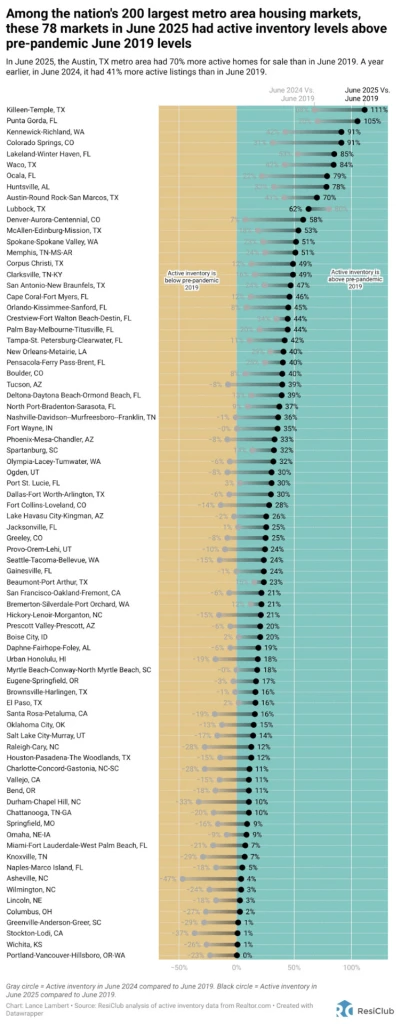
Among these 78 markets, you’ll find lots in Sun Belt markets like Florida, Texas, Arizona, and Colorado.
Many of the softest housing markets, where homebuyers have gained leverage, are located in Gulf Coast and Mountain West regions. Some of these areas were among the nation’s top pandemic boomtowns, having experienced significant home price growth during the pandemic housing boom, which stretched housing fundamentals far beyond local income levels.
When pandemic-fueled domestic migration slowed and mortgage rates spiked, markets like Cape Coral, Florida, and San Antonio, Texas, faced challenges as they had to rely on local incomes to sustain frothy home prices. The housing market softening in these areas was further accelerated by the abundance of new home supply in the pipeline across the Sun Belt. Builders in these regions are often willing to reduce net effective prices or make other affordability adjustments to maintain sales. These adjustments in the new construction market also create a cooling effect on the resale market, as some buyers who might have opted for an existing home shift their focus to new homes where deals are still available.
In contrast, many Northeast and Midwest markets were less reliant on pandemic migration and have less new home construction in progress. With lower exposure to that demand shock, active inventory in these Midwest and Northeast regions has remained relatively tight, keeping the advantage in the hands of home sellers.
Generally speaking, housing markets where inventory (i.e., active listings) has returned to pre-pandemic levels have experienced softer/weaker home price growth (or outright declines) over the past 36 months. Conversely, housing markets where inventory remains far below pre-pandemic levels have, generally speaking, experienced more resilient home price growth over the past 36 months.
ResiClub PRO members can find our latest inventory analysis for +800 metros and +3,000 counties here, and our latest analysis showing why the 2019 inventory comparison remains insightful here.
What's Your Reaction?
 Like
0
Like
0
 Dislike
0
Dislike
0
 Love
0
Love
0
 Funny
0
Funny
0
 Angry
0
Angry
0
 Sad
0
Sad
0
 Wow
0
Wow
0