


Zillow’s new ratings reveal whether it’s a buyer’s or seller’s housing market in over 250 metros
Want more housing market stories from Lance Lambert’s ResiClub in your inbox? Subscribe to the ResiClub newsletter.
Zillow economists use an economic model known as the Zillow Market Heat Index to gauge the competitiveness of housing markets across the country.
This model looks at key indicators—including home price changes, inventory levels, and days on market—to generate a score showing whether a market favors sellers or buyers.
Higher scores point to hotter, seller-friendly metro housing markets. Lower scores signal cooler markets where buyers hold more negotiating power.
According to Zillow:
- Score of 70 or above = strong sellers market
- Score from 55 to 69 = sellers market
- Score from 44 to 55 = neutral market
- Score from 28 to 44 = buyers market
- Score of 27 or below = strong buyers market
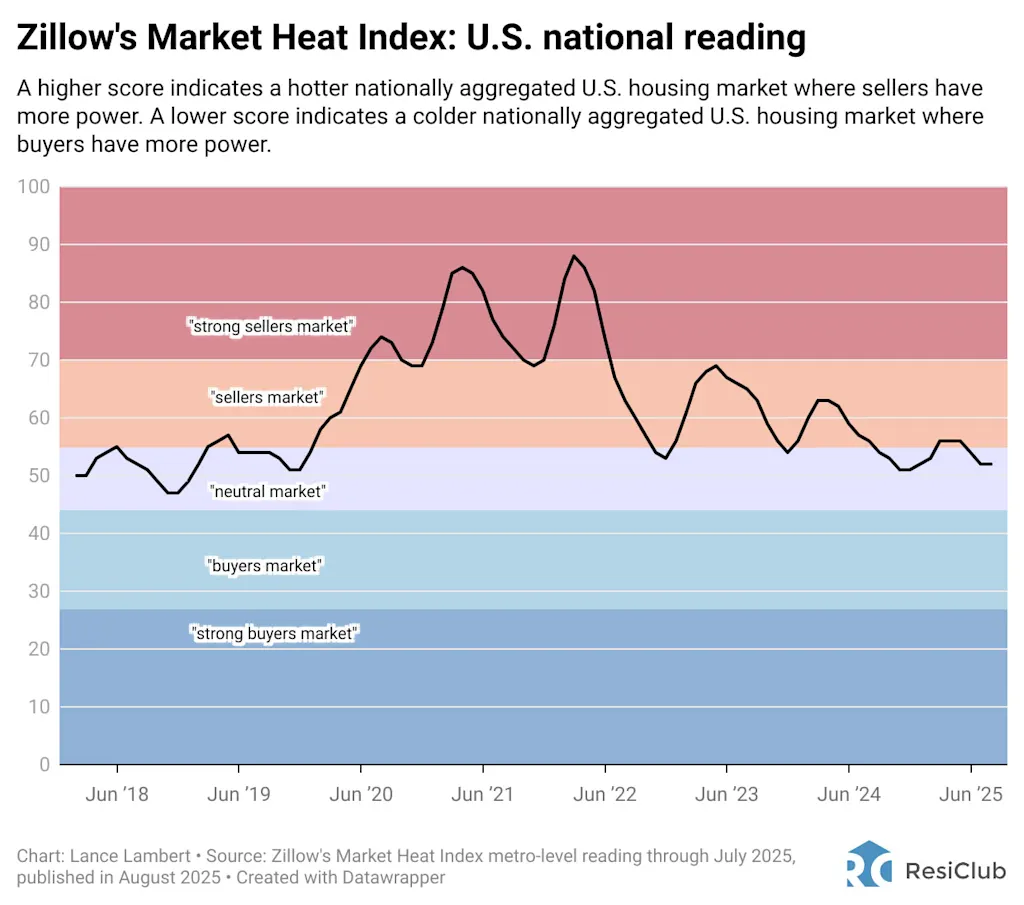
Nationally, Zillow rates the U.S. housing market at 52 in its July 2025 reading, published this month.
That said, Zillow’s reading varies significantly across the country.
Among the 250 largest metro area housing markets, these 10 are the HOTTEST markets, where sellers have the most power:
- Rochester, NY → 145
- Syracuse, NY → 91
- Hartford, CT → 87
- Buffalo, NY → 87
- Charleston, WV → 86
- Binghamton, NY → 80
- Springfield, MA → 77
- Albany, NY → 75
- Poughkeepsie, NY → 75
- Norwich, CT → 75
- Springfield, IL → 75
- Kingston, NY → 75
- Lansing, MI → 73
- Ann Arbor, MI → 73
- Bridgeport, CT → 72
Among the 250 largest metro area housing markets, these 10 are the COLDEST markets, where buyers have the most power:
- Jackson, TN → 13
- Terre Haute, IN → 21
- Macon, GA → 24
- Lafayette, IN → 25
- Asheville, NC → 26
- Beaumont, TX → 26
- Gulfport, MS → 27
- Brownsville, TX → 28
- Naples, FL → 28
- Daphne, AL → 28
- Lubbock, TX → 29
- Panama City, FL → 30
- Punta Gorda, FL → 31
- Longview, TX → 32
- Waco, TX → 32
Does ResiClub agree with Zillow’s assessment?
Directionally, I believe Zillow has correctly identified many regional housing markets where buyers have gained the most power—particularly around the Gulf—as well as markets where sellers have maintained (relatively speaking) somewhat of a grip, including large portions of the Northeast and Midwest.
Based on my personal housing analysis, I consider Southwest Florida the weakest/softest chunk of the U.S. housing market. Not too far behind are pockets of Texas, Colorado, and Arizona markets where there’s built up unsold spec inventory.
In my view, many West Coast markets are softer right now than Zillow’s analysis suggests—in particular the areas that have recently seen big jumps in active inventory for sale.
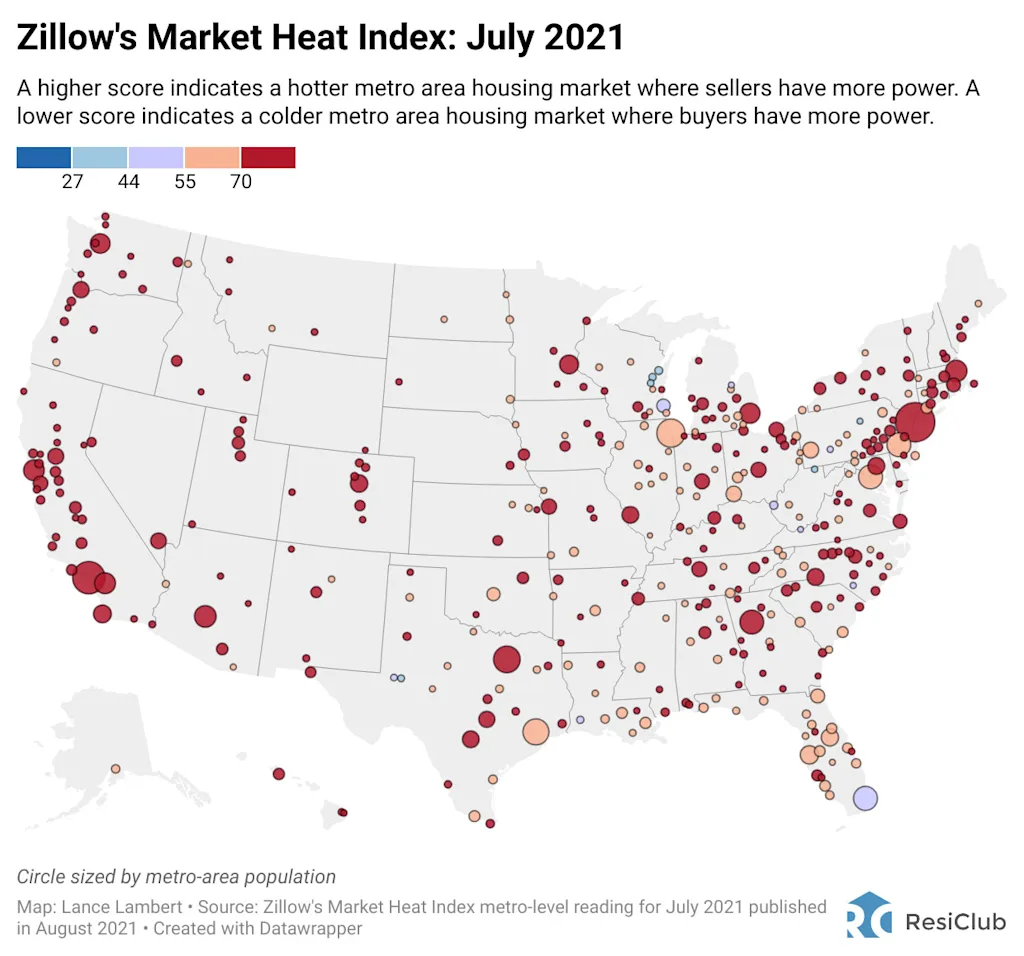
What did this Zillow analysis look like back in spring 2021 during the Pandemic Housing Boom? Below is Zillow’s July 2021 reading—published in August 2021.
What's Your Reaction?
 Like
0
Like
0
 Dislike
0
Dislike
0
 Love
0
Love
0
 Funny
0
Funny
0
 Angry
0
Angry
0
 Sad
0
Sad
0
 Wow
0
Wow
0