


Redfin: These 31 major housing markets have shifted to buyer’s markets

Want more housing market stories from Lance Lambert’s ResiClub in your inbox? Subscribe to the ResiClub newsletter.
During the pandemic housing boom, housing demand surged rapidly amid ultralow interest rates, stimulus, and the remote work boom—which increased demand for space and unlocked “WFH arbitrage” as high earners were able to keep their income from a job in, say, New York City or Los Angeles, and buy a home in, say, Austin or Tampa.
Federal Reserve researchers estimate that “new construction would have had to increase by roughly 300% to absorb the pandemic-era surge in demand.” Unlike housing demand, housing stock supply isn’t as elastic and can’t ramp up as quickly. As a result, the heightened pandemic era demand drained the market of active inventory and overheated home prices, with U.S. home prices rising a staggering 43.2% between March 2020 and June 2022.
Of course, a lot has changed since then.
Not long after mortgage rates spiked in 2022 and return-to-office mandates gained a bit of momentum, national demand in the for-sale market pulled back and the pandemic housing boom fizzled out.
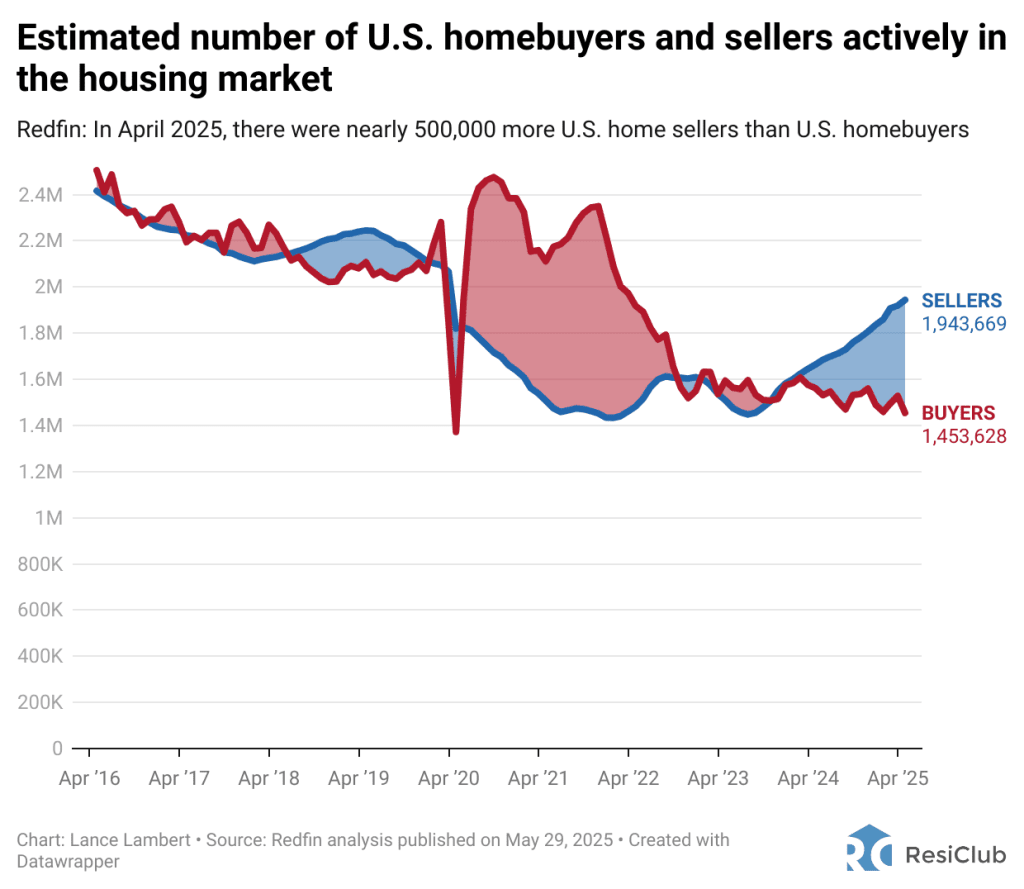
The longer we’ve remained in this strained housing demand environment, the more the total number of U.S. active sellers is outmatching the total number of active homebuyers.
According to a recent Redfin analysis, there were nearly 490,041 more U.S. home sellers than buyers in April 2025. That’s the most that home sellers have outmatched homebuyers in over a decade.
For comparison, at the height of the pandemic housing boom in April 2022, there were 436,106 more U.S. homebuyers than sellers.
“The balance of power in the U.S. housing market has shifted toward buyers, but a lot of sellers have yet to see or accept the writing on the wall. Many are still holding out hope that their home is the exception and will fetch top dollar,” writes Redfin economist Asad Khan. “But as sellers see their homes sit longer on the market and notice fewer buyers coming through on tour, more of them will realize that the market has adjusted and reset their expectations accordingly.”
According to Redfin, there’s a wide variation across the country. That’s something that ResiClub has also previously noted.
Most of the softest housing markets where homebuyers have the most power are in the Sun Belt—in particular, pockets of Texas, Florida, Colorado, and Arizona. While the tightest markets where home sellers still have the most power are in pockets of the Northeast and Midwest.
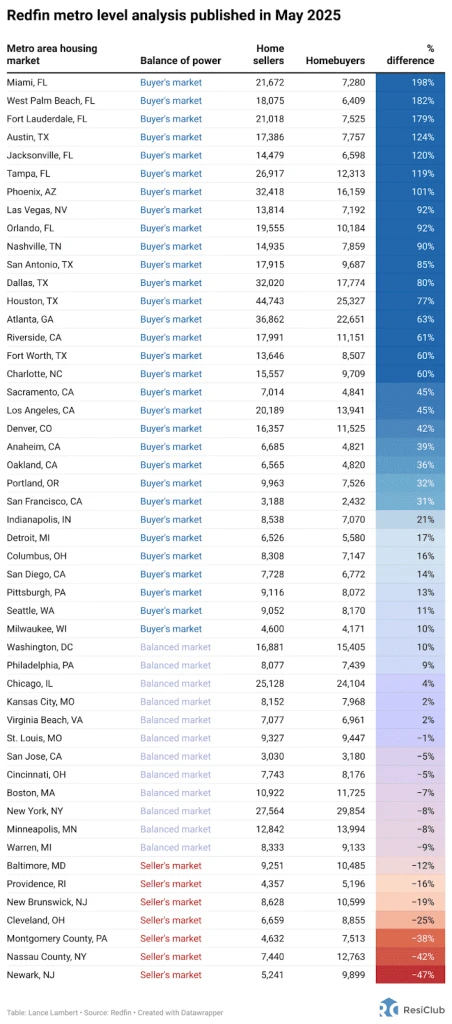
While regional variation continues to exist, the housing market across much of the country has, directionally speaking, shifted toward homebuyers over the past year.
How did Redfin calculate this?
“The number of sellers in the market is simply active listings, or the total number of homes actively for sale at any point during a given month. Active listings data come from the MLS,” writes Redfin.
Redfin economists added: “Because there is not a similar metric measuring how many buyers are actively in the market, we developed one. We took active listings and pending sales from the MLS [multiple listing services] to estimate what fraction of homes on the market will sell within a given month. Analogously, we estimated what fraction of buyers on the market will find a home within a given month using Redfin data on the typical time from first tour to purchase. The ratio of these two data points approximates the ratio of buyers to sellers in the market. We then multiplied that ratio by the number of active listings to get the estimated total number of buyers in the market. Note that our estimate of buyers is not based on Redfin traffic or customer acquisition data, and the purpose of this analysis is to measure the number of buyers and sellers in the housing market as a whole. All metrics that go into our calculation of the number of buyers and sellers in the market are seasonally adjusted.”
In terms of market labels, Redfin economists view the current housing market as a little softer/weaker than Zillow economists do. (You can find Zillow’s updated market labels here.)
What's Your Reaction?
 Like
0
Like
0
 Dislike
0
Dislike
0
 Love
0
Love
0
 Funny
0
Funny
0
 Angry
0
Angry
0
 Sad
0
Sad
0
 Wow
0
Wow
0